...
When viewing detail data the Icon will move across the graph according to the Row you hover hovered or select selected with your the Mouse
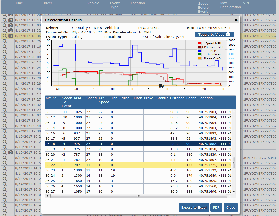
In addition to the line graph visual, the Deceleration report features a second-by-second spreadsheet breakdown of the 90 seconds around a hard braking event, featuring metrics such as cruise control usage, clutch usage, distance and bearing.
...