...
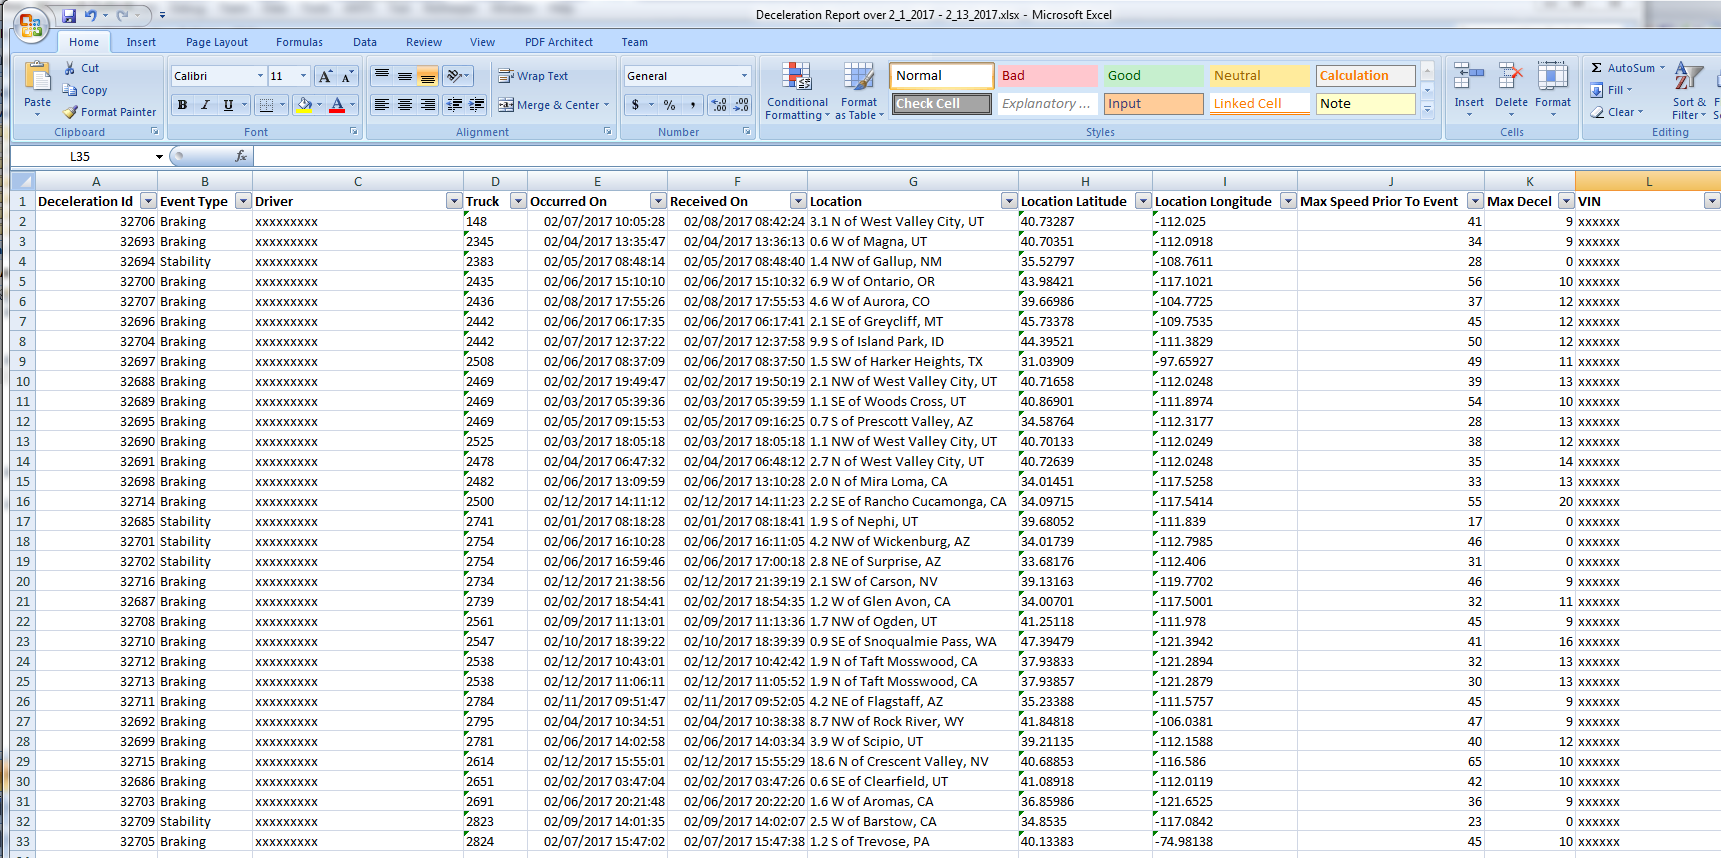
The Deceleration Events report displays the number of rapid deceleration events and lists the greatest change in MPH experienced during those events. The Deceleration Events report can be run for a specific driver or vehicle, and driver or vehicle group.
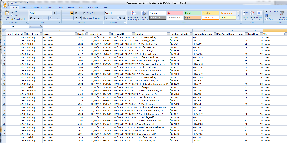
Retrieve records by selecting a Driver/Vehicle/Group and Date Range then click [Get Results] and you will be presented with the list of available records which will also include a camera Icon for those which DTVideo was also captured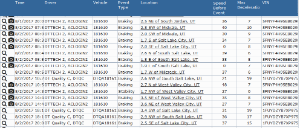
Clicking on the Camera Icon will display only the DTVideo captured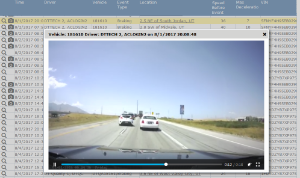
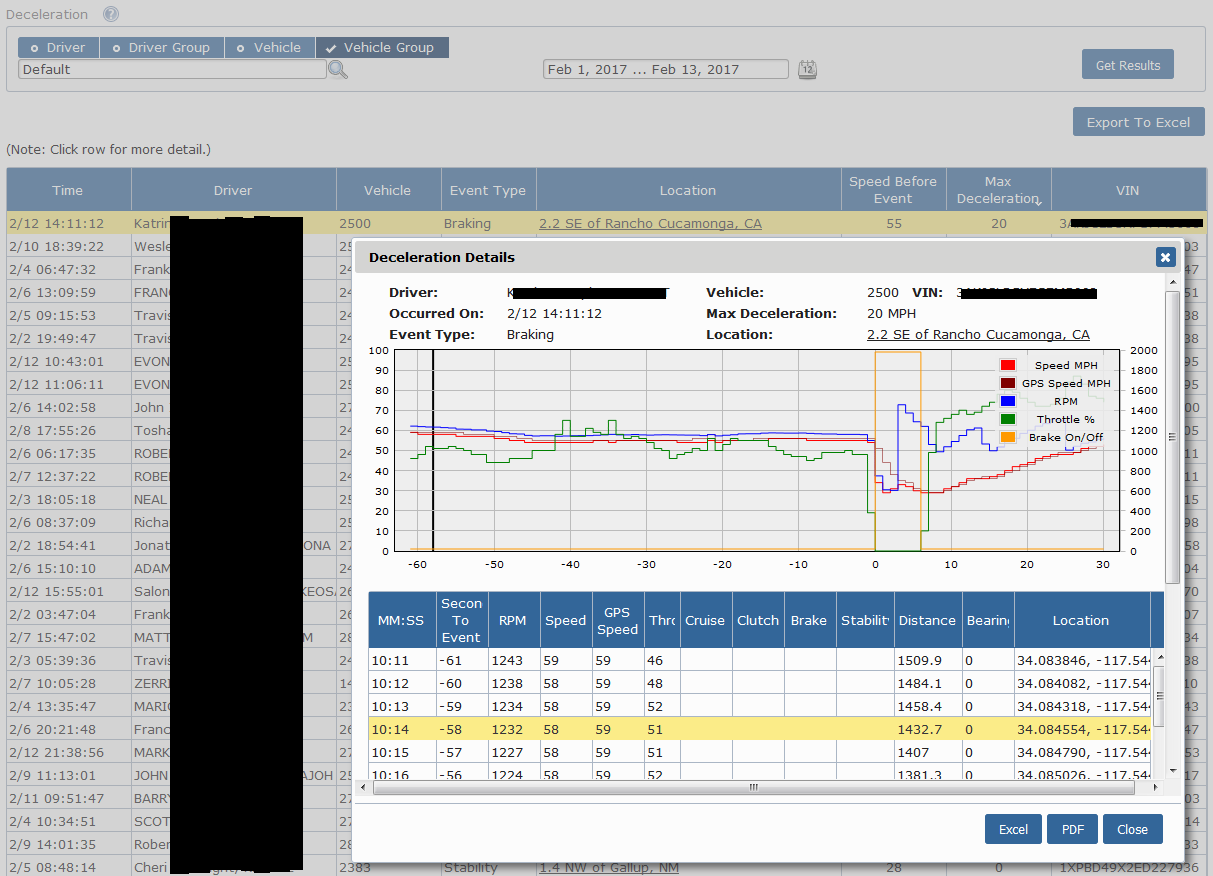
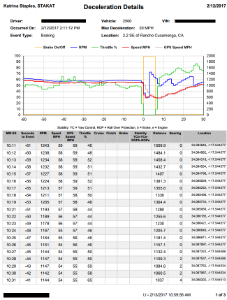
Clicking on the Row or the Magnifier Icon will display the full detail including the Second-by-Second event history and option to Toggle between Detail and Video at the upper right.
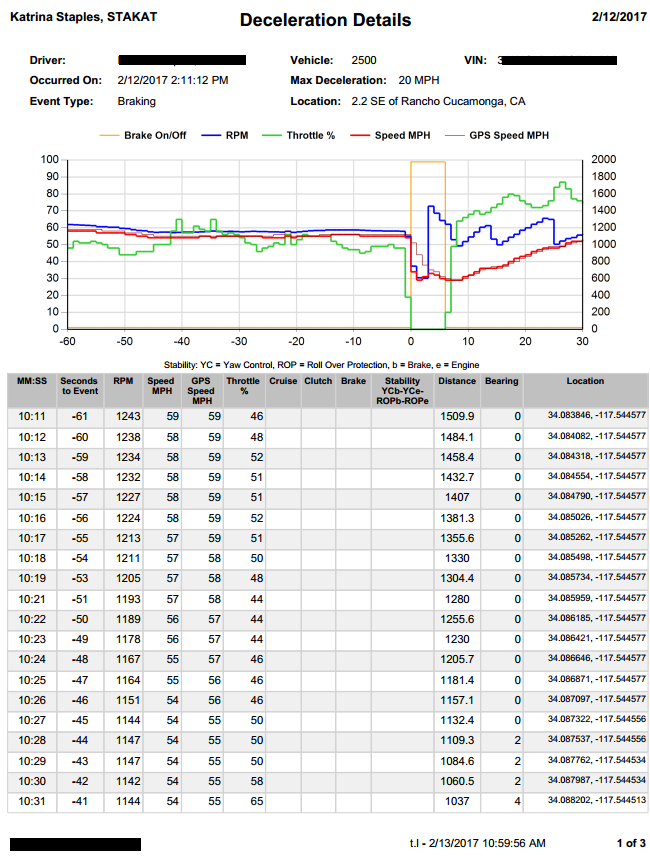
The Critical Event graph will provides Speed, RPM, Throttle State, Brake Usage, Yaw, Pitch and Roll during the Eventyou can select the icon next to a particular driver or vehicle to show all possible metrics included in the report. For example if you run the report by driver or vehicle group, clicking the icon next to a selected driver or vehicle will display all the deceleration events of that particular driver or vehicle (including time, vehicle, location and the maximum deceleration of each event). From here, click on an individual deceleration event entry. The Critical Event graph will then display, showing the speed, RPM, throttle status, and brake usage of the driver. The line graph shows 90 seconds surrounding the event: the 60 seconds before the event and the 30 seconds after. You can also hover your mouse over the lines on the line graph to display how the
When on video view, the Graph will display an Icon to indicate relative time in the Graph related to the Current Video time.
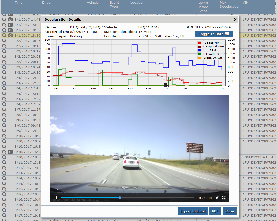
When viewing detail data the Icon will move across the graph according to the Row you hover or select with your Mouse
 four metrics listed above change as you move your cursor across the graph, giving you a second-by-second recreation of what occurred during the event.
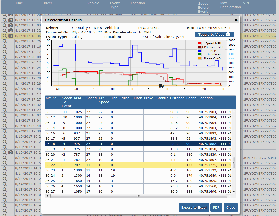
In addition to the line graph visual, the Deceleration report features a second-by-second spreadsheet breakdown of the 90 seconds around a hard braking event, featuring metrics such as cruise control usage, clutch usage, distance and bearing.
toc